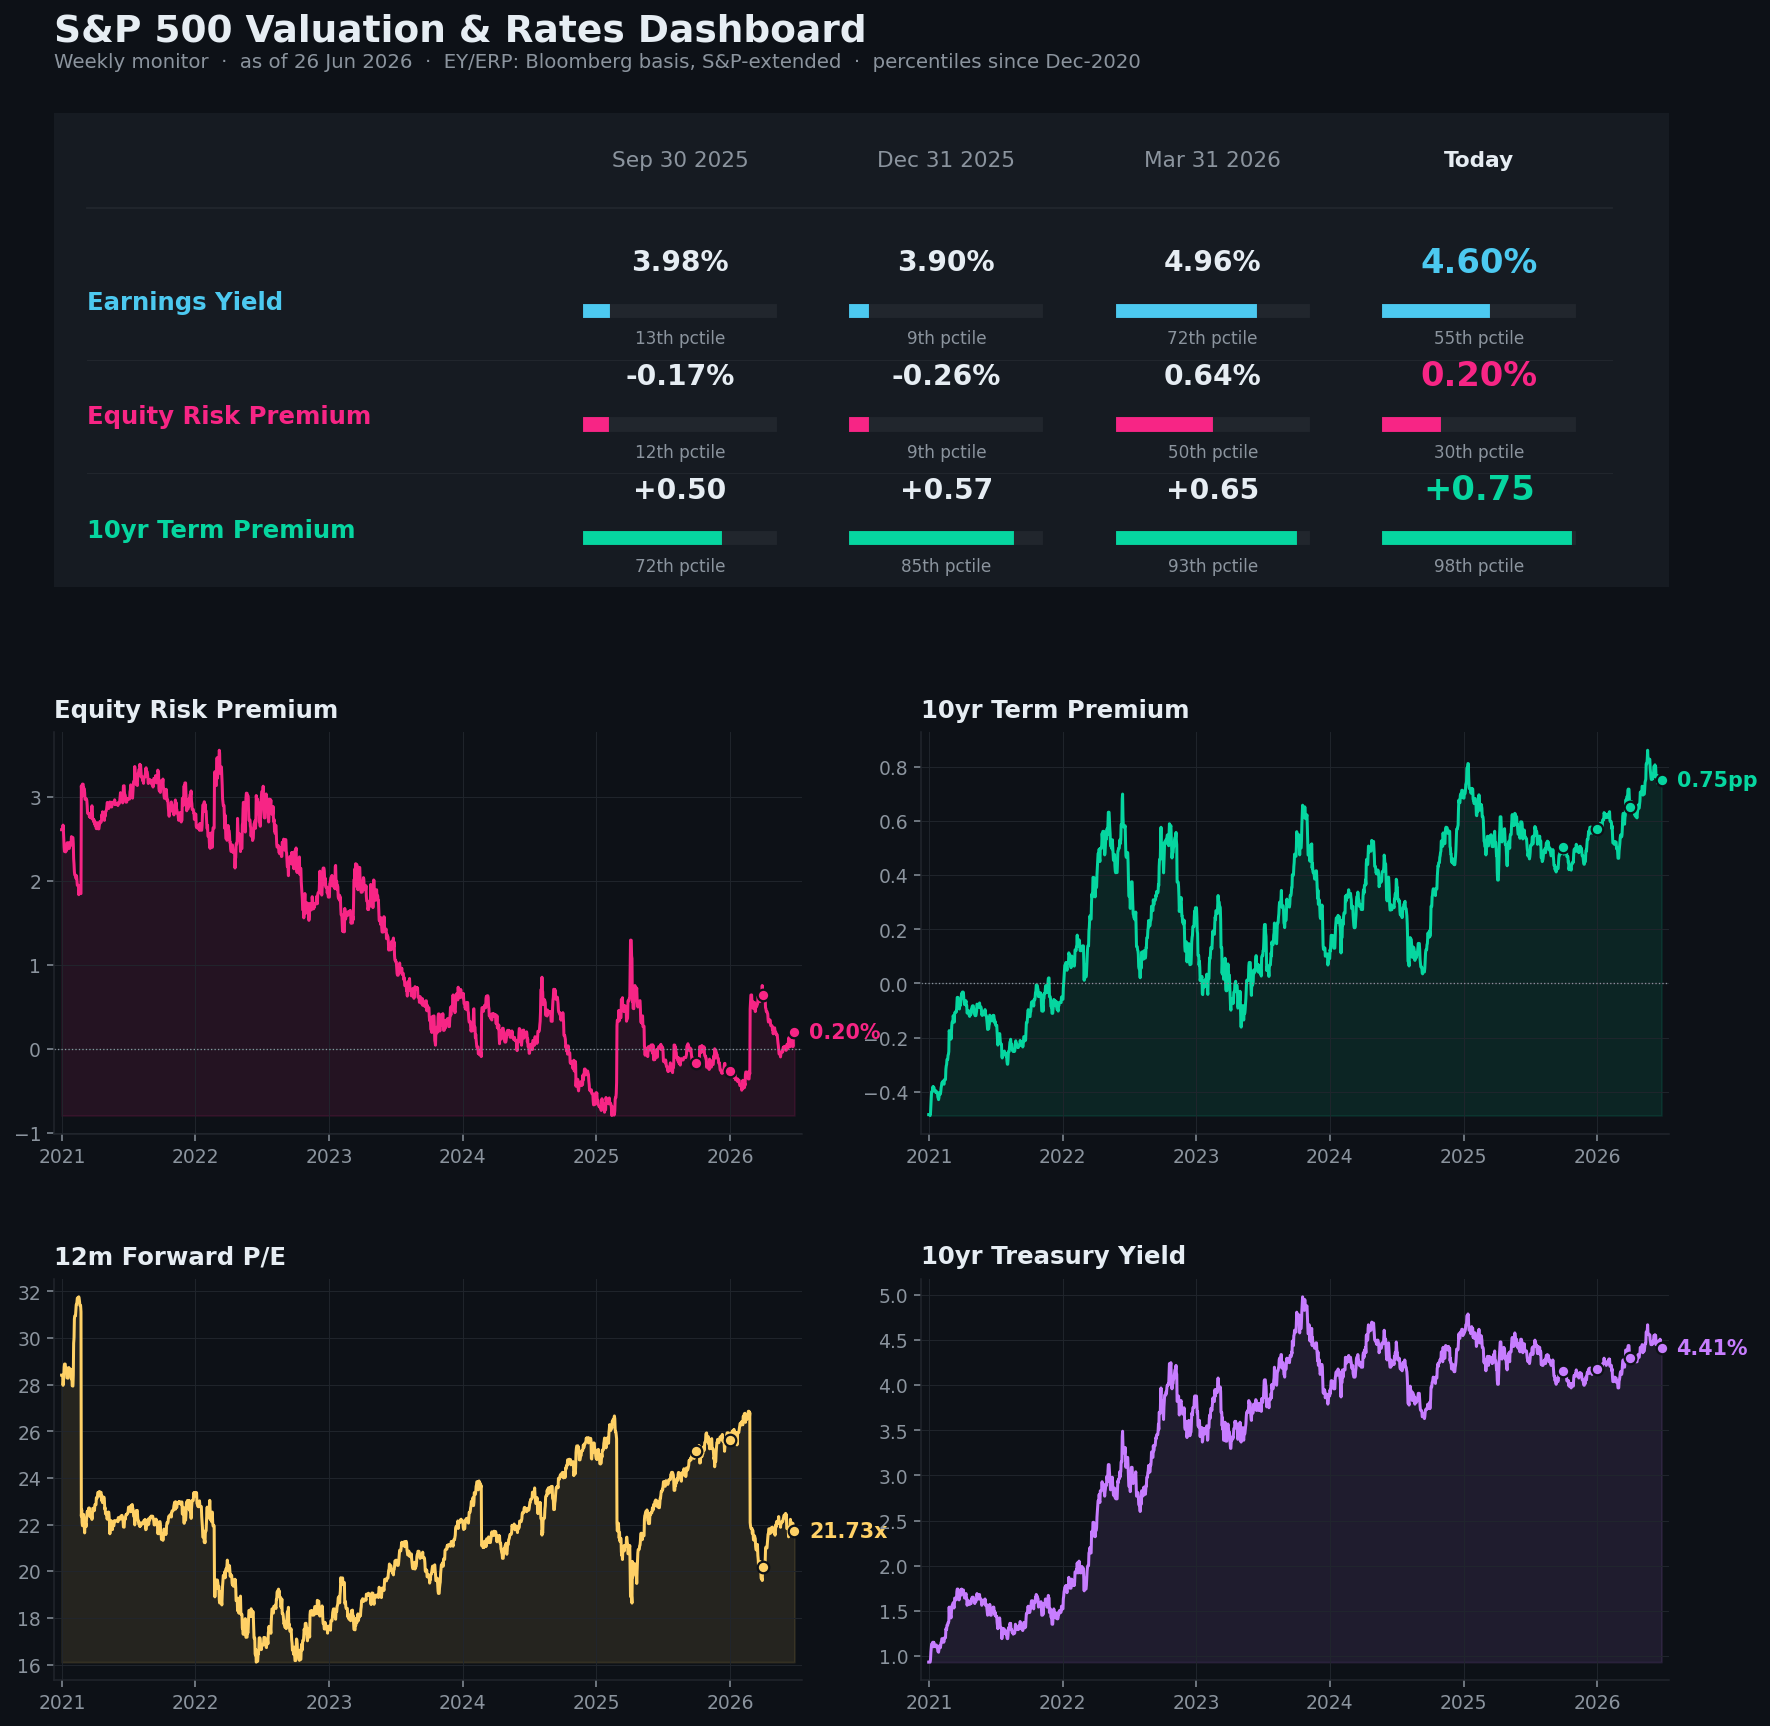
S&P 500 Valuation & Rates
| Metric | Dec 31 2025 | Mar 31 2026 | Jun 30 2026 | Today |
|---|---|---|---|---|
| Earnings Yield | 3.90% 9th pctile | 4.96% 73rd pctile | 4.52% 47th pctile | 4.50% 43rd pctile |
| Equity Risk Premium | -0.26% 9th pctile | 0.64% 50th pctile | 0.08% 26th pctile | -0.05% 18th pctile |
| 10yr Term Premium | +0.57 84th pctile | +0.65 92nd pctile | +0.70 95th pctile | +0.78 99th pctile |
Understanding the dashboard
This monitor answers one question each week: how much are you being paid to own US stocks and long bonds right now, and how does that compare to the recent past? Three headline numbers in the table, with four charts below them.
S&P 500 Earnings Yield
The earnings the market expects over the next 12 months divided by the index price. It is the “yield” you earn from owning the S&P 500 — the mirror image of the forward P/E. Higher means cheaper stocks; lower means more expensive.
Equity Risk Premium (ERP)
The earnings yield minus the 10-year Treasury yield — the extra return stocks offer over a “risk-free” government bond, i.e. your reward for taking equity risk. A wide ERP means stocks look cheap versus bonds; a thin or negative ERP means they do not.
10-Year Term Premium (Kim-Wright)
The part of the 10-year yield not explained by expected Fed policy — the extra compensation investors demand for locking money into a long bond instead of rolling short-term bills. It rises when investors worry about inflation, deficits, or the supply of bonds.
Percentiles
Beside each number is its percentile since 2020 — where today sits within its own recent range. 50th is the middle; near 100th is unusually high; near 0 is unusually low. This is what turns a raw number into a “rich or cheap” read.
Chart 1 — Equity Risk Premium
The headline valuation signal for stocks versus bonds. It has fallen from roughly +4.7% in 2021 to around zero today — the S&P now yields about the same as a 10-year Treasury, with none of its former cushion. When this line is high, equities are generously priced relative to bonds (a tailwind); when it is near zero or negative, you are taking equity risk for little or no premium.
Chart 2 — 10-Year Term Premium
This tells you why long rates move. When the 10-year yield rises, this separates “the market expects the Fed to stay tight” from “investors demand more to hold duration” (this line). It has climbed from negative in 2020-21 to near the top of its range today — bond investors now want real compensation for duration, reflecting fiscal and inflation uncertainty. A rising term premium pressures both long rates and equity valuations independently of what the Fed does.
Charts 3 & 4 — Forward P/E and the 10-Year Yield
The other two charts add context. The 12-month forward P/E is the earnings yield flipped over — a P/E of 20 is a 5% yield — so it rises as stocks get more expensive and is the most familiar way to see valuation. The 10-year Treasury yield is the risk-free anchor that the equity risk premium is measured against; when it climbs, stocks have to work harder to justify their premium.
Reading them together
The combination is the point. When the ERP is thin and the term premium is high — roughly where we are now — equity risk is barely compensated while bond-duration risk is richly compensated. That mix tends to favour caution on stretched equity valuations and makes long-duration bonds comparatively more interesting.
Appendix — methodology & operations
A · How the numbers are computed
FactSet’s forward 12-month figure is a continuously-rolling, time-weighted blend of the current
and next calendar-year bottom-up estimates — so the window reaches roughly six months into the
following year and shifts a little every day, rather than stepping at quarter-ends. As of this report the
12-month window extends to about 2Q2027. Each metric’s percentile ranks its
current value against its own history since December 2020 (the PERCENTRANK convention, mean
handling of ties), reproduced to the decimal.
B · Data sources
| Series | Source | Notes |
|---|---|---|
| S&P 500 level | yfinance ^GSPC | daily close |
| Forward earnings | FactSet Earnings Insight forward 12m P/E (weekly PDF) | earnings yield = 1 ÷ P/E |
| EY / ERP history | Bloomberg real-time forward earnings | chart & percentile baseline (see C) |
| 10-year yield | FRED DGS10 | constant-maturity par yield |
| 10-year term premium | FRED THREEFYTP10 | Federal Reserve Kim-Wright model |
C · The Bloomberg anchor
A forward earnings yield cannot be rebuilt point-in-time from a current estimate vintage, because the recent quarters carry realized earnings — using them would give history an unfair hindsight advantage and distort every percentile. So the earnings yield and ERP are anchored to Bloomberg’s real-time forward-earnings history. Any dates after the Bloomberg file’s end are extended with the live FactSet earnings yield, shifted by a small calibration offset measured over the overlap so the two bases line up at the splice. The offset is logged on every run.
In this build, Bloomberg history runs through 25 Jun 2026; every date after it is FactSet-anchored. The handoff moves forward automatically whenever you refresh the Bloomberg seed file.
D · Dating & refresh
Percentiles are ranked since December 2020 (adjustable). The FactSet Earnings Insight report is fetched automatically each run — it sits on a public CDN with no bot protection, so the script simply walks back from today to the most recent published PDF (released Fridays) and reads the forward P/E from its text; the last good value is cached and reused if a fetch ever fails. The Kim-Wright term premium is published with roughly a one-week lag, so its “today” value is the most recent available reading. Everything else is current to the prior session.
E · Running it
- Scheduled: launchd, every Friday 06:00 SGT — builds the dashboard, deploys this page, posts to Discord.
- Manual:
python3 sp500_valuation_monitor.py(add--no-postto build locally, or--show-peto just print the current FactSet P/E). - Web: this page lives at
chris-sp500-valuation.pages.dev, redeployed each run. - Discord: a weekly post with the dashboard image, the three headline readings, and a link back here.
F · Caveats
- Earnings yield and ERP are on a Bloomberg (Street) basis; the live value uses FactSet’s forward P/E calibrated to match, not Bloomberg directly.
- FactSet’s forward 12-month window is a blended current/next calendar-year figure that rolls continuously, so it reaches into the second year and the forward P/E moves smoothly rather than stepping at quarter-ends.
- The 10-year term premium is a model estimate and carries a one-week publication lag.
- Percentiles span only since 2020; against a deeper history the term premium in particular would rank lower.
- This is a market-monitoring tool, not investment advice.